







Power BI Financial Dashboard
Transform Your Data into Insights

Our Financial Dashboard in Power BI gives you real-time insights into your revenue, expenses, profit margins, and key KPIs — all in one dynamic, interactive interface.

Finance Dashboard Power BI
0 +

Students
ENROLLED

0 +

Clients
SERVED

0 TB+

Data
PROCESSED

0 +

Projects
DELIVERED

Financial Analytics Dashboard for Data-Driven Decisions

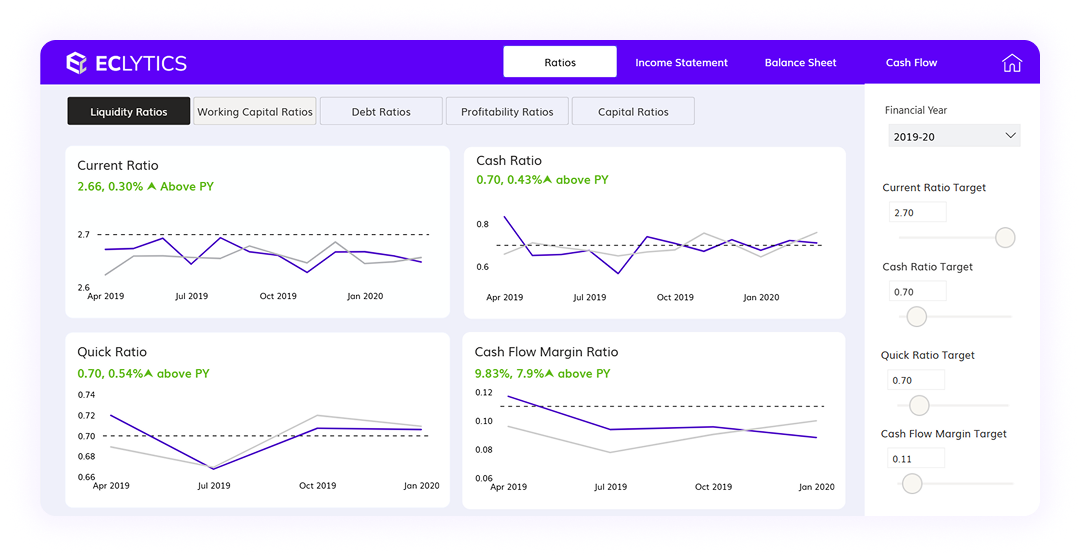
Ratios

A Ratio is a way to compare two or more quantities by showing how many times one value contains or is contained within the other.

  • Ratios can be simplified like fractions.
  • They do not have units (e.g., not “3 cm to 2 cm”, just 3 : 2)
  • They help in making comparisons and understanding proportions

P&L Report

A P&L Report, short for Profit and Loss Report, is a financial statement that shows a company’s revenues, costs, and expenses over a specific period — such as a month, quarter, or year.

Attrition
Emp Cost

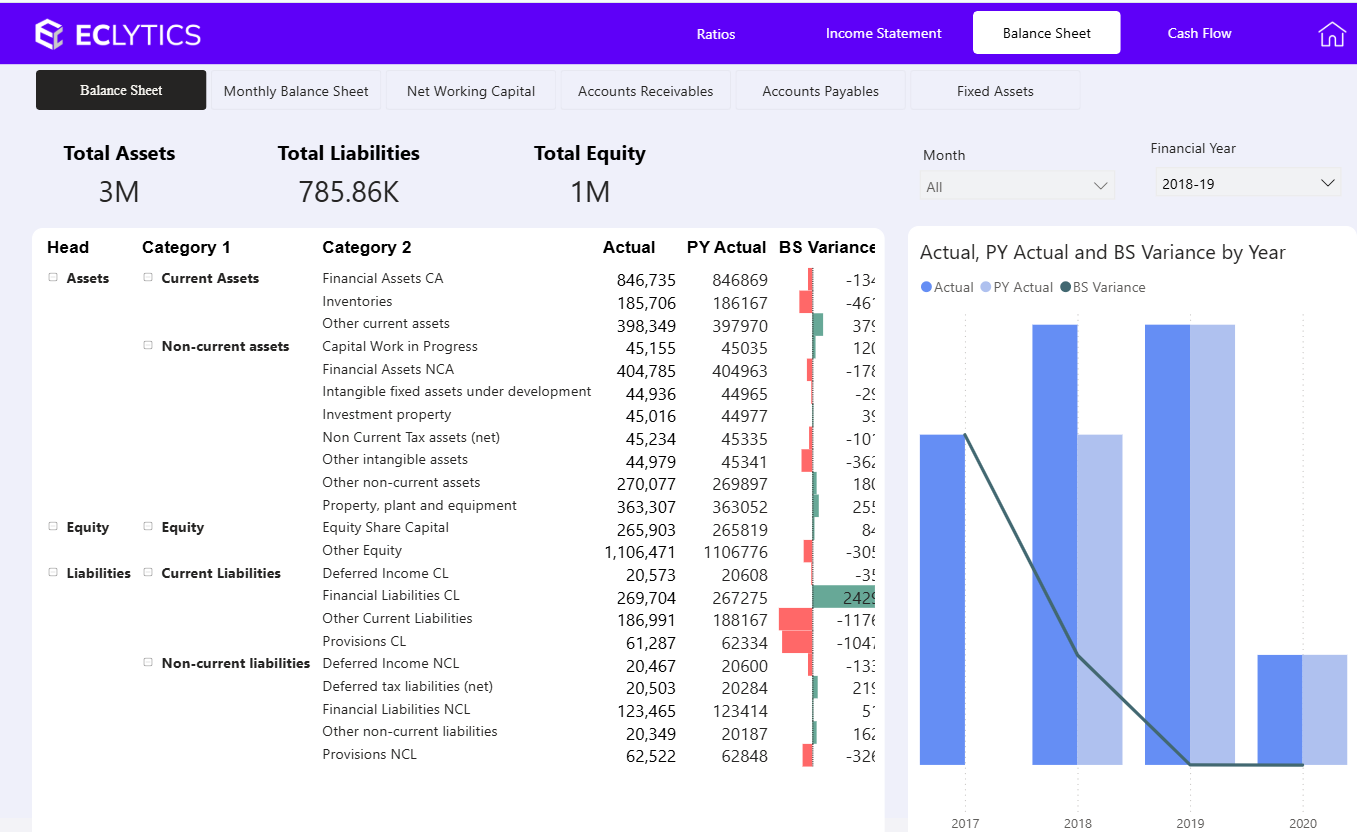
Balance Sheet

A Balance Sheet is a financial statement that shows a company’s financial position at a specific point in time — what it owns, what it owes, and its net worth (equity).

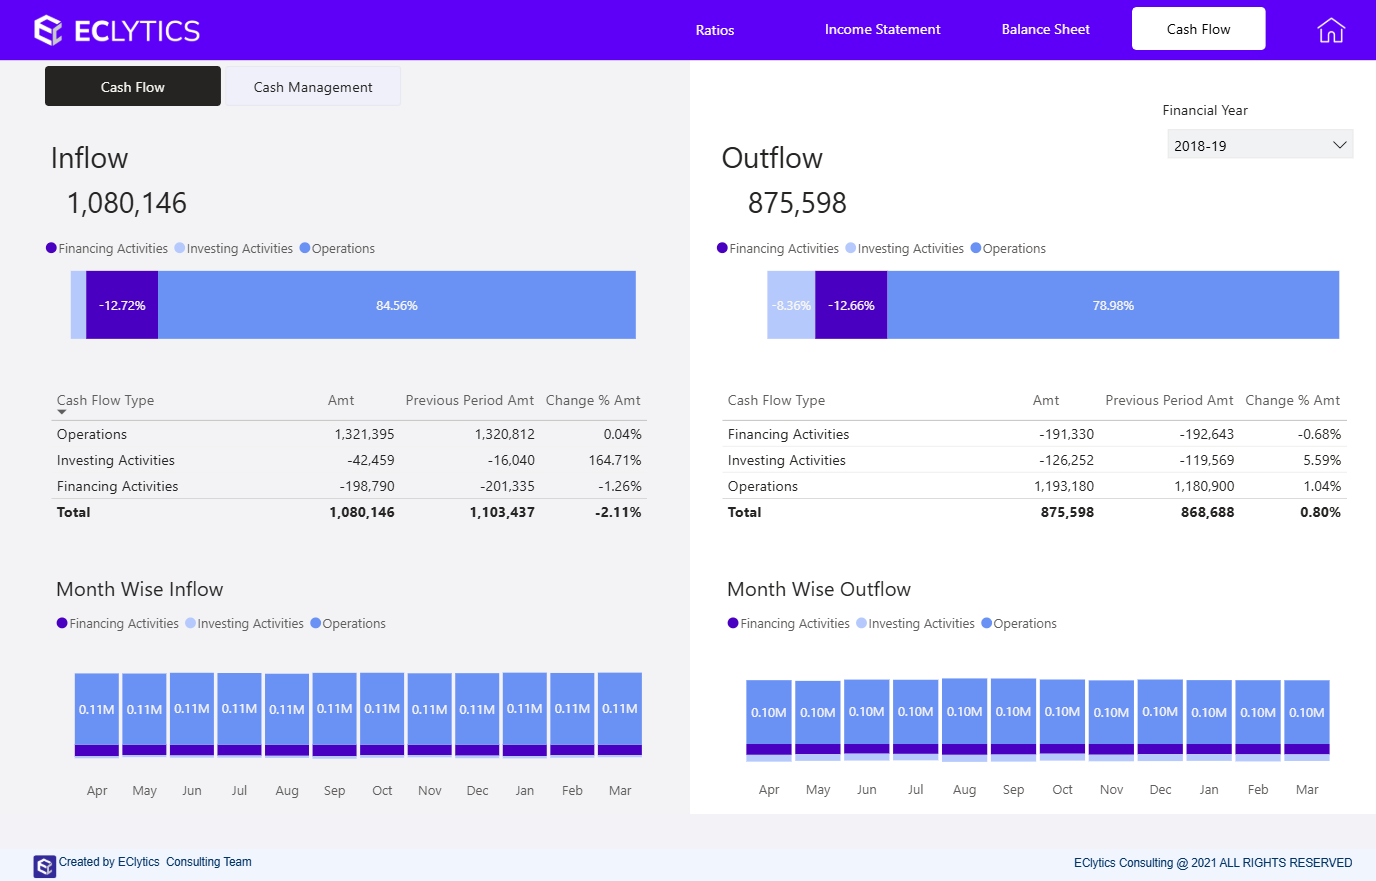
Cash Flow

Cash Flow refers to the movement of money in and out of a business over a specific period.

Cash Flow = Cash Inflows – Cash Outflows

L&D
Recruitment

Receivable

Receivable refers to money that is owed to you or your business by customers for goods or services you’ve already delivered.

Payable

Payable refers to the money you or your business owe to others — usually for goods or services received but not yet paid for.

Expense

Financial Analytics Dashboard for Data-Driven Decisions

Do you want to boost the growth of your business using Modern Power BI Financial Dashboard?

Using Power BI, we can design dynamic and intelligent Power BI financial Dashboard analytics solution for your organization. This financial analysis is generally taken from your accounting software like ERP’s General Ledger (GL)/SAS/Oracle etc. It includes important performance metrics, visualizations, and a consolidated financial report that can be viewed interactively using any device.

Our Power BI financial dashboard provides a comprehensive snapshot of a company’s important indicators. This information is essential for any CEO, CIO or executive leader. Create secure and specialized financial dashboards for each level of your organization so you can maintain a real-time check on all of your activities. Monitor financial KPIs such as:

Evolve your Financial Reporting Using Power BI

Interactive Dashboard

Create visually appealing Power BI financial dashboards to view and analyze data in order to obtain business insights.

Scheduled Refresh

You can define the frequency and time periods for refreshing the dataset in the Scheduled refresh section.

Advanced Analytics

Business users can utilize the advanced analytics feature to examine data & gain insights at all levels of the organization.

Mobile View Dashboards

Connect and interact with your cloud and on-premises data with Power BI financial Dashboard in mobile app.

Self-Service BI

Self-service Power BI financial Dashboard is a data analytics method that allows non-BI users to access and examine datasets.

ALert-002.png

Alerts

Users can obtain essential business information in the quickest & most efficient way possible with the help of alerts.

Clients we have served across globe

Why you should ECLytics
Financial Analytics Dashboard?

One Shop Platform

Create visually appealing dashboards to view and analyze data in order to obtain precise business insights.

Optimized Calculations

You can define the frequency and time periods for refreshing the dataset in the Scheduled refresh section.

Team of
Experts

We have a team of highly proficient yet experienced team of experts providing you with the best of our resources.

End-to-End Integration

We offer end to end integration for all the complex data sourced from various locations hence providing you with a smart yet simple solution.

Our Customers Loves US

"The models created by the EClytics team enabled us to target our retention efforts and take immediate action to retain at-risk customers. The insights from their analysis also enabled us to make strategic decisions which boosted customer lifetime value."
client
Rajib Kumar Jha
Nestle India Private Limited
"When we first contacted EClytics, we needed expert advice on the creation of the sales dashboard for our data. Their team analyzed our work and provided a clear road map. Since we were so pleased with the outcome, we contacted them again for the inventory dashboard as well.”
client
Ata John Ochil
D&D Ingrident Distributors
"I highly recommend EClytics. The total package: excellent credentials, strong statistical and data mining skills, the initiative to anticipate client needs, compelling and concise communications, strong client management skills, and a results-driven mindset.”
client
Neha Dhawan
Michelin India Private Limited
"EClytics built world-class Dashboard for our company. Easy to filters reports day, week, monthly wise data. There are lots of other options which will help us to increase our business. Thanks ECLytics team."
prashant nayak
Prashant Nayak
Web dev buddies
"I worked together with Lokesh and his team on at least 5 analytic tasks over 3 years for a mutual client. They are consummate professionals – they bring an uncommon skill-set to bear on every engagement."
client
Dr. Anindya Bhattacharya
The Celestial Earth
"EClytics Consulting team provides insights, ideas, and suggestions to better our business. We are very happy with the sales and inventory dashboards they made for our company."
Aashish Malik
D'Decor Home Fabrics Pvt. Ltd.
EClytics Consulting

Get In touch with us

Get personalised advice and responses to your questions.