
Power BI Interview Questions
Types of Schemas in Data Modeling, learn to choose the best for you
Data modeling is a critical component of designing efficient Power BI. Two popular types of Schemas are the star schema and the snowflake schema. Both are used to organize data in a way that enhances query performance and simplifies data analysis. Understanding the differences between these two schemas is essential for database designers and business intelligence professionals.
This article explores the key differences between both the types of schemas: star schema and the snowflake schema.
Star Schema
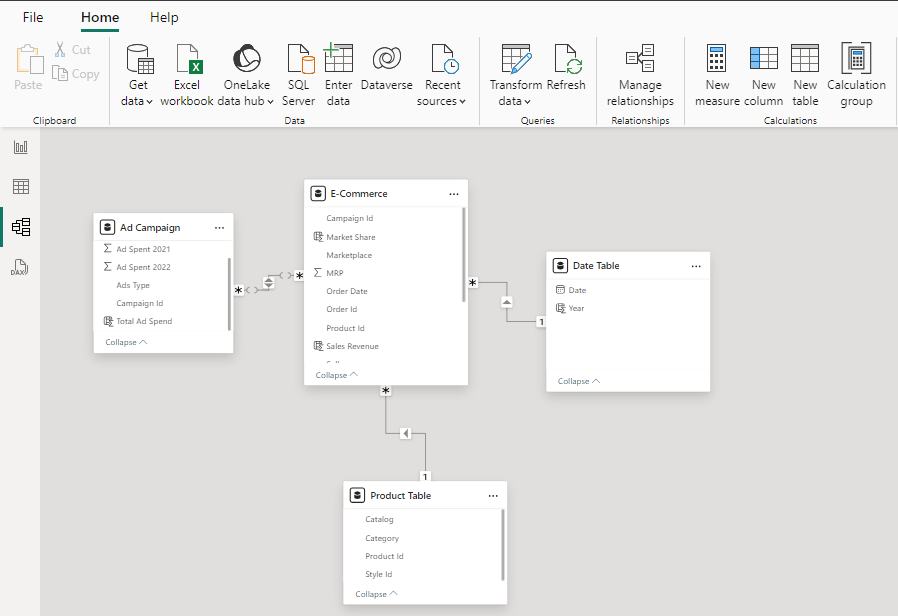
The star schema is a straightforward and commonly used data modeling approach in Power BI. It consists of a central fact table connected to multiple dimension tables, forming a star-like structure. This schema from both types of schemas is particularly favored for its simplicity and efficiency in query performance.
In the given screenshot, there is one fact table, labelled Sales Data, which is linked to several dimension tables. These dimension tables include the Product table, which holds information about products, the Customer table, which contains customer details, the Return table, which records return transactions, and the Date table, which provides date-related data. This setup illustrates a star schema, where the central fact table (E-commerce) is connected to multiple dimension tables to facilitate efficient data analysis and reporting.
- Features:
- Central Fact Table: Contains quantitative data such as sales amounts, transaction counts, or performance metrics. It stores the facts of the business process being analyzed.
- Dimension Tables: Contain descriptive attributes related to the facts, such as product details, customer information, and time periods. These tables provide context to the facts.
- Denormalized Structure: Dimension tables in a star schema are typically denormalized, meaning they contain redundant data to avoid complex joins and improve query performance.
- Advantages:
- Simplicity: Easy to understand and implement, making it suitable for users with limited database design knowledge.
- Query Performance: Denormalized dimension tables reduce the need for complex joins, resulting in faster query performance.
- User-Friendly: The straightforward structure of the star schema makes it easier for end-users to navigate and generate reports.
Snowflake Schema
The snowflake schema is an extension of the star schema, where dimension tables are further normalized into multiple related tables, forming a snowflake-like structure. This approach reduces data redundancy and improves data integrity but can increase complexity.
In the given image, we have the same tables as before, with the addition of one extra table containing data related to the Customer table. This new table is connected to the Customer table, creating a more complex structure known as a snowflake schema. Unlike the star schema, where dimension tables are directly connected to the fact table, the snowflake schema further normalizes the dimension tables by breaking them into related sub-tables, thereby reducing redundancy and improving data organization. This setup enhances data integrity and supports detailed data analysis.
- Features:
- Normalized Dimension Tables: Dimension tables are decomposed into multiple related tables to reduce redundancy.
- Hierarchical Structure: Supports hierarchical relationships within dimensions, allowing for more detailed data organization.
- Fact Table: Like the star schema, the snowflake schema also has a central fact table containing quantitative data.
- Advantages:
- Reduced Redundancy: Normalizing dimension tables reduces data redundancy and improves data integrity.
- Scalability: The hierarchical structure can handle more complex and large-scale datasets.
- Detailed Data Organization: Provides a more granular view of the data, supporting detailed analysis.
Fact Table and Dimension Table
In both types of Schemas, we have two types of tables, let’s learn about them below:
Fact Table
A fact table, central in a star schema, stores quantitative data for analysis. It contains measurable metrics like sales amount, revenue, or cost, and is often denormalized. Fact tables have foreign keys that reference dimension tables, linking the quantitative data to descriptive attributes for comprehensive analysis.
A fact table is the central table in a star schema of a data model. It stores quantitative data for analysis and is often denormalized. Fact tables contain measurable, quantitative data such as sales amount, Quantity, Discount, Profit, and they have foreign keys referencing dimension tables.
Key Characteristics
- Contains measures or metrics: E.g., sales amount, transaction count.
- Has foreign keys: Links to dimension tables.
- Data is often numeric and additive: Suitable for aggregations like sums or averages.
Dimension Table
A dimension table contains descriptive attributes related to the facts. These attributes provide context for the facts stored in the fact table. Dimension tables are often denormalized to improve query performance.
Key Characteristics
- Contains descriptive data: product name, customer location.
- Primary keys: Unique identifiers that relate to foreign keys in the fact table.
- Provides context and filters for facts: Used in query constraints and to group data.
Example In Power BI
Imagine we have a retail business, and we want to analyze sales data. Our data model includes a fact table called Sales and several dimension tables like E-commerce, Ad Campaign, Product Table and Date Table.
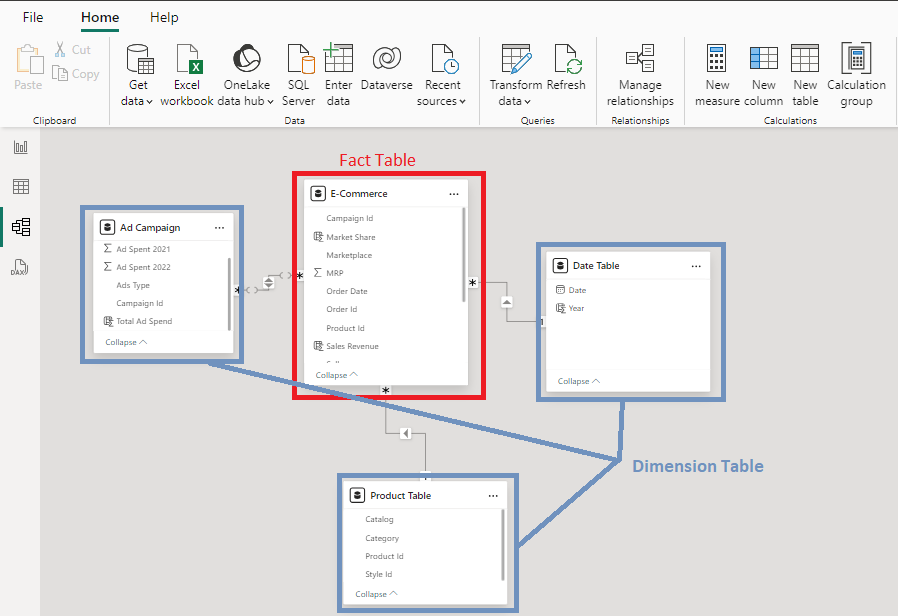
- Fact Table (E-commerce):
- Campaign ID (Foreign Key)
- Market Share
- Market Place
- MRP
- Orde Date (Foreign Key)
- Order ID
- Product ID (Foreign Key)
- Sales Revenue
- Dimension Table (Ad Campaign):
- Ad Spent 2021
- Ad Spent 2022
- Ads Type
- Campaign ID (Foreign Key)
- Total Ad Spent
- Dimension Table (Product Table):
- Catalog
- Category
- Product ID (Foreign Key)
- Style ID
- Dimension Table (Date):
- Date (Foreign Key)
- Year
Conclusion
Data modeling generally has 2 types of schemas which are most effective star and snowflake for which we have talked about in this article. Choosing which one to use is dependent on users need. The star schema is known as the best as it has simplicity and fast performance. It also as denormalized structure which is ideal for users and straightforward but on the other hand snowflake schema with more dimension tables reduces data redundancy and increase integrity which offers more detailed analysis. Select the right schema which balances the complexity, relationships and performance.
Add comment