
Power BI Interview Questions
2 Ways of Filters in Power BI
Filters in Power BI Is an essential tool which allows us to control how much or what data should be displayed in our reports and visualisation. Using Power query, we can transform this data more specific using filters which shows clearer and meaningful insights.
We have two types of filters in Power BI
- Filter by Rows
- Filter by Values
Filter by Rows
In this type of Filters in Power BI, we can filter table based on the position of, we can either remove them or keep them. Let’s see all the techniques Power BI offers to filter the data.
Keep Rows
Keep rows option gives us choice to keep either Top N rows, Bottom N rows and, keep range of rows
We can find the reduce rows group on the Home tab as we can see in the Below Image.
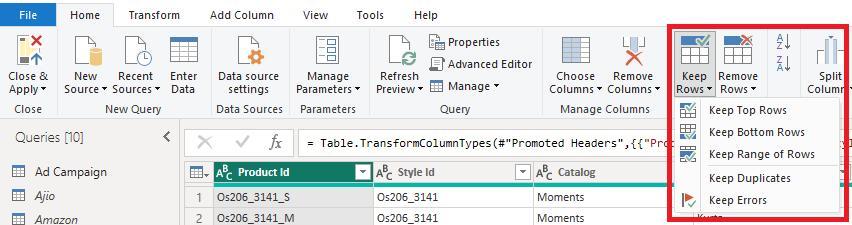
a. Keep Top rows: By using this we can keep top n number of rows of table.
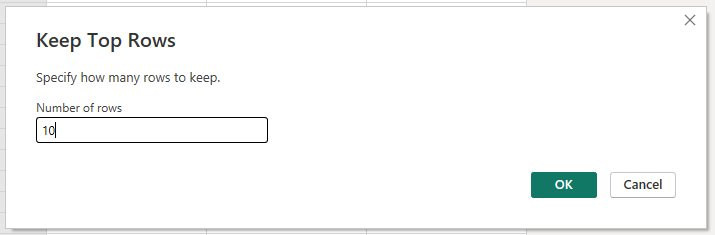
In the below image we can see there are only 10 rows.
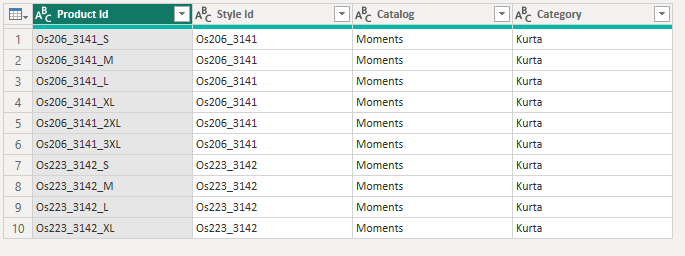
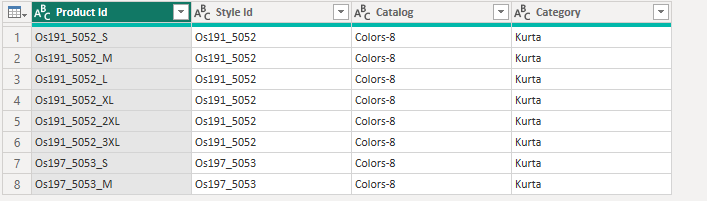
b. Keep Bottom Rows: By using this we can keep bottom n number of rows.
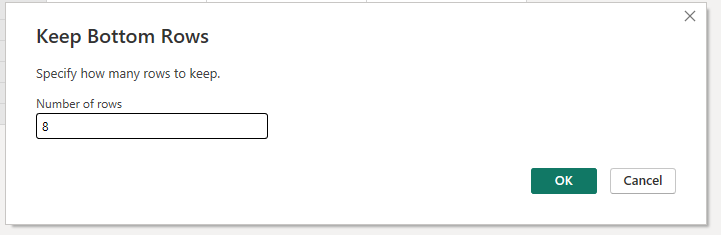
In the below image we can see there are only 8 rows remaining.
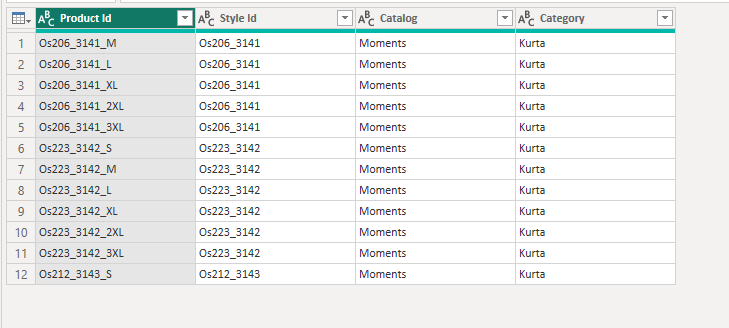
c. Keep range of row: By using this we can define the first row which should be there after filter and number of rows to be show.

Now we can see the output have 12 rows which and the 2nd row in the first row after filtering
Remove Rows
It is the vice versa of what we have learnt above, instead of keeping rows we are removing rows from the data set but there is a slight difference in the 3rd option.
- Remove Top rows
- emove Bottom rows
- Remove Alternate rows
Let’s directly jump on the 3rd point: –
Remove Alternate Rows: In this technique, we have to define 3 parameters in the dialogue box.
- First row to remove: It will start removing the top row from here, anything before this will be kept.
- Number of Rows to remove: Here we will define how many rows we have to remove every time. Here we are defining the pattern.
- Number of rows to keep: After we remove the specific number of rows, we are defining how many rows to be kept.

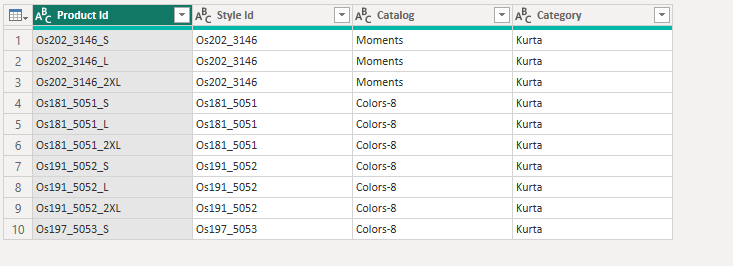
Here, We are asking power query that start removing rows from 2nd position and remove one row and after removing one row keep the next one row in the data set as it is.
In the below image you can see the output of the following:
Filter by Values
In Power Query filters in Power BI, we can keep or remove rows based on specific values in our data set. We get techniques to filter values: –
- Sort and Filter Menu
- Cell Shortcut Menu
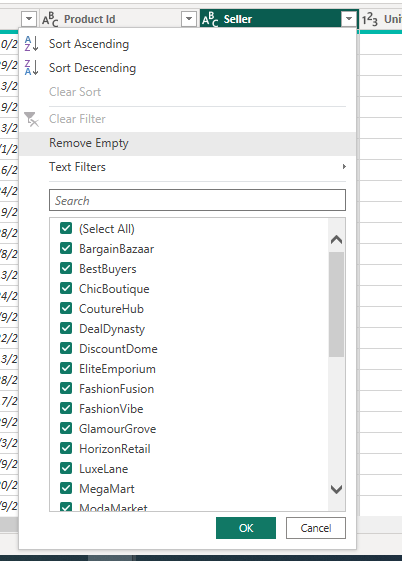
- Sort And filter Menu: We can open this menu by clicking on the downward arrow on the right side of the header names as shows in the image below. We can choose specific values by selecting them to include or exclude.
- You can see Remove Empty option; it is usedto remove the rows which have empty values in the selected column.
- There is a Clear Filter option; it appears when a filter is applied to the selected column which helps to remove any filter which is applied.
- Auto Filter is the list were we can see the unique values available in our column by this we can manually select or deselect the values which we want to show in the table.
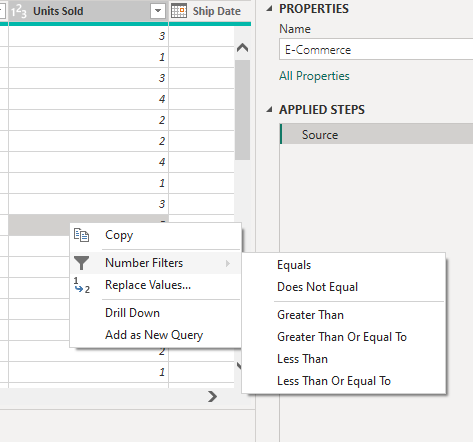
2. Cell Shortcut Menu: We can right click on a particular cell to open a shortcut menu. Here we can see Text Filters or number filter based on the data type of the column which again open a list where we can choose the type of filter according to our requirements as shows in the image below.
Conclusion
Filters In Power BI is important feature to customize data and enhance insights. Filters are used to manage rows and values to refine the data so we can focus on what is more important. We can either keep or remove rows or filter based on the specific values according to user requirements. By mastering these techniques, we can ensure that our reports are specific and meaningful.
Add comment