
Power BI Interview Questions
Index Column in Power BI, everything is easy with Power Query
Index Column in Power BI assigns a unique identifier value to each row in our database which is useful for managing the order, it simplifies the row referencing and helps in sorting and filtering as well.
In default Index column either starts from 0 or 1 we can choose from both options, but Power Query also offers to add a customized index column where we can choose the initial value or starting value and define the increment of the index values.
Power Query has made everything easy for us by giving all the options in the Add column Ribbon so even people who are new to this field can also transform the data as their requirement.
Let’s look at one example where we will add an Index Column in Power BI
As our first step stays the same, just load and transform the data to open the Power Query Editor. As you can see it in the below image.
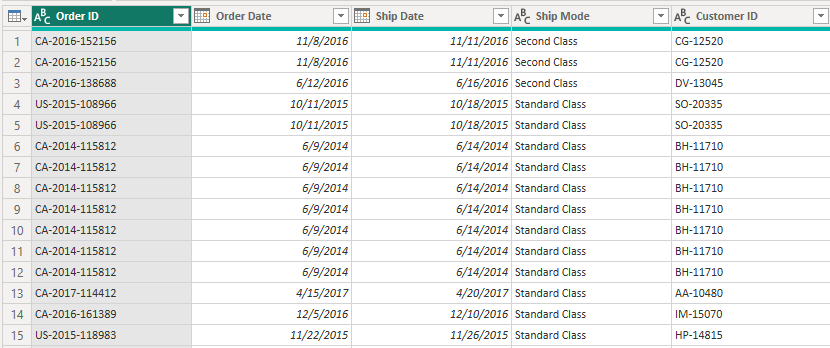
Here we have a data set in which there is no Index Column. So, our goal is to add the Index column which will help us in the original order of the data in case of filtering or sorting.
We will use the custom function as the 0 or 1 options will take the initial value as 0 and 1 and increment every row by 1 but in custom option, we can define both ourselves.
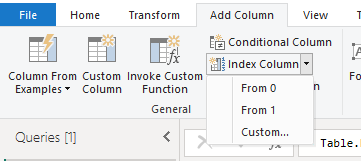
Let’s go to the “Add column” ribbon and click on the dropdown of “add index column” and choose “Custom”. As you can see in the following image.
After clicking on that an Index Column window will appear on our screen where we must Input the initial value and increment.
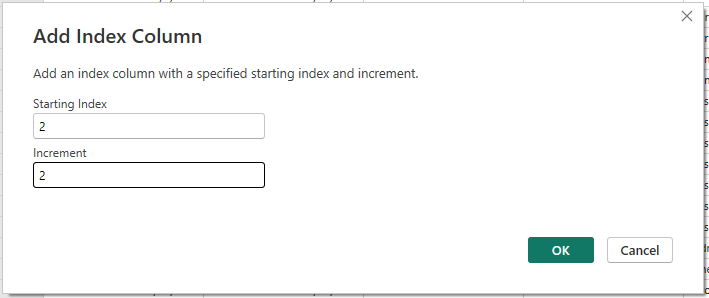
We have defined the starting index as 2 and increment also 2. So now a new column should be added to our query. Let’s hit OK and watch what happens.
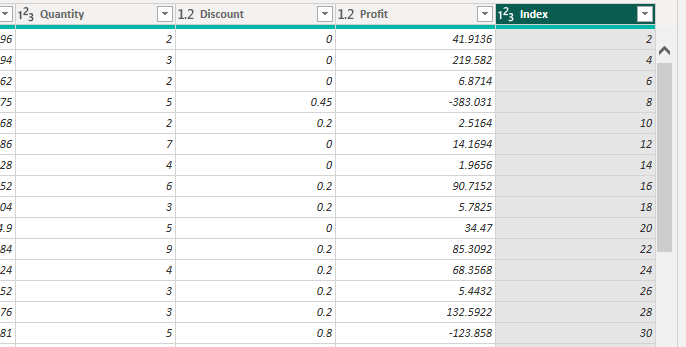
As you can see a new column has been added to our query where the starting value is 2 which is getting increased by 2 as well. So, we have completed our goal and now if you want you can drag the column in the starting as well.
- Generally, the Index column always starts with 0 or 1, but if we want, we can add it according to our requirement.
- We can also add the index column by using DAX functions which we will learn in further topics of Power BI.
Conclusion
Index Column in Power BI is quite a simple yet useful tool that provides efficiency in data transformation and analysis. By assigning a unique identified value to each record the original order of rows is preserved. Row referencing, sorting and filter functions can be used efficiently. Power Query makes this task easily accessible for every user.
We can use the default choice for the starting value, or we can use custom option to create the Index Column according to the user’s requirement.
More than that Power BI also offers us the chance to add columns using DAX function where we can use different conditions of user’s requirements.
Add comment