
Power BI Interview Questions
Unlock the 2 ways of Group by in Power BI Using Power Query Editor
Group By in Power BI using Power Query Editor is a crucial step in data analysis and visualization. It allows you to organize and summarize Big Data, makes it easier to analyze and interpret.
What is Grouping?
Grouping is used to group data points together based on specific criteria, such as values in a column or a combination of columns. It is also known as summarizing of data as we categorize the data for a certain row or column.
What is Aggregation?
Aggregation in Power Query is a powerful feature that allows you to summarize data by grouping and combining values from a table.
Some points you should know while using Group by in Power BI using Power Query
- It helps us in summarizing the data to find trends or visualize data based on groups or categories.
- We can group data based on single column as well as multiple columns using single or multiple aggregation.
Let’s see how to Group data in Power BI
Group by in Power BI using Power Query by single column
We have loaded the data and are ready to transform it in the power query editor.
At first, we are taking example to group by the data by single column and single aggregation.
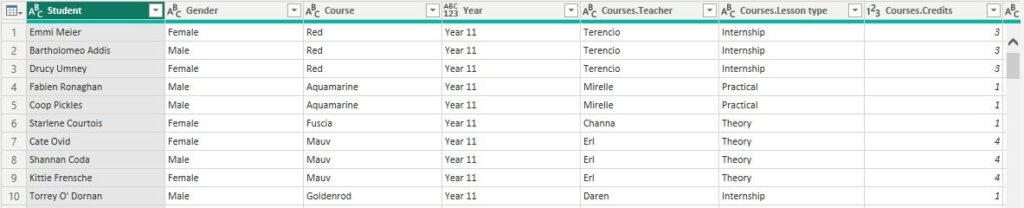
The data has the following headers such as Student, Gender, Course, Year, course_Teacher, course_lesson type, course.credits, and course_assesment type.
Now we want to group the courses so we will know the number of students on each course.
After that we will go on the Home tab where we can find group by option in the Power Query window (as shown in the image below)

As you can see in the below image, a new window will appear where we must fill in the required details to group the data.

We have chosen the Basic settings which will let us choose only single row and single aggregation to group by the data.
Here, we are choosing the course column to group by the data, and we will count the number of rows. (It will make the groups based on the courses and tell us the number of rows in each course.)
You can see in the below image we have gotten number of students in each curse available on our data set.
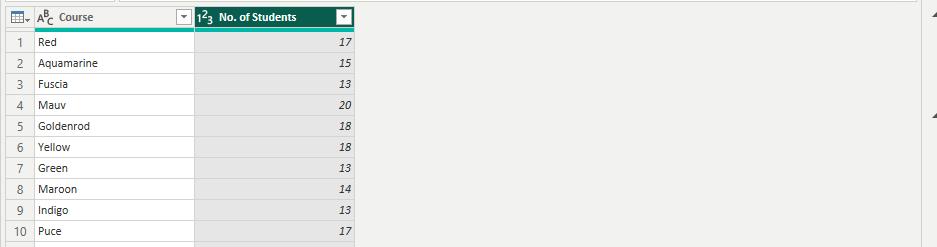
The above operation was Basic Group by, Let’s see How advanced settings works where we can choose multiple columns to group and multiple aggregation.
Group by in Power BI using Power Query by Multiple Columns
You just need to select the advanced button after selecting Group by as you can see in the below picture.
Let’s group the courses column and the year column and for aggregation, we are counting the number of rows to find out the number of students, and total credit in each course by sum operation on the courses_credit column.
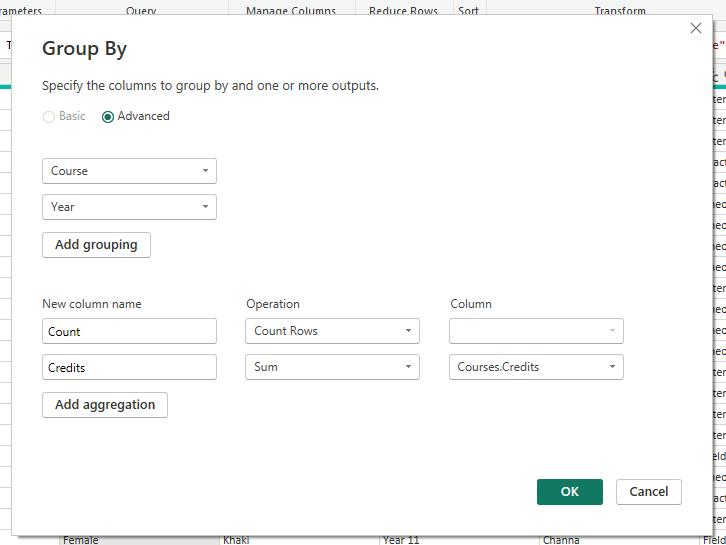
After completing the above steps, we will get the following output where we can see the count of students and total credits of each course year wise. (As shown in the below picture)

Conclusion
Group by in Power BI using Power Query is an extremely useful tool to summarize and analyze big data sets with the help of using aggregations. By group by function, we can categorize data based on column or criteria which helps us in finding trends and patterns in our data set.
In the examples, we showed how to group data by a single column with a single aggregation and by multiple columns with multiple aggregations. These techniques enable you to:
- Summarize data to find trends and visualize information based on groups or categories.
- Group data based on single or multiple columns.
- Perform single or multiple aggregations to derive meaningful insights.
By using Power Query, we can transform our data in many ways efficiently which helps us to get deeper insights and make our reporting effective.
We can also group by data using DAX functions in Power BI which we will see in further topics
Add comment