
Power BI Interview Questions
Power BI Fundamentals
- What is Business Intelligence? Differences between BI & BA
- What is Power BI?
- What are the Components of Power BI?
- What is Power BI Desktop?
- What are the Top 10 Powerful Uses of Power BI Desktop?
- What Are Power BI Workspaces, and How Do Roles and Permissions Work?
- What Do Power BI Dataflows Do? Key Features Explained
Data Load and Transformation
- Power Query Editor
- Learn How to use Power Query Editor
- It is effortless to Append and Merge in Power BI. Learn How!
- Pivot and Unpivot Data in Power BI made easy
- Number Transformation in Power Query Editor
- It's easy to create a Conditional Column in Power Query
- Custom Column in Power BI using Power Query is super easy now
- Unlock the 2 ways of Group by in Power BI Using Power Query Editor
- Add a Column from Examples, A new way to transform your data
- Index Column in Power BI, everything is easy with Power Query
- 2 Ways of Filters in Power BI
- Extract Text in Power BI
- Data Sorting in Power BI
- Data Types in Power BI
- Custom Sorting in Power BI
- An easy way to add Financial Year into Date Table in Power BI
- What is Power Query Editor?
- How can I append, combine, or union data in Power Query?
- How can I delete duplicates in Power BI or Power Query?
- How do I merge two tables in Power Query? What are the various options for merging two tables in Power Query/BI?
- How can you use Power Query to get the column distribution/Quality/Profile for a column of data?
- You have two tables, A and B, with the same structure. You want to create a third table, C, which contains the values in A that are not in B?
- How Can I replace a value with a null or null value with a something in power query?
- What is Group By in Power Query?
- How to add a column with a unique row id/number?
- What are the best ways to analyze data where months are given as columns in Power BI?
- How to split text values in a column in multiple rows?
- How to load data in Power BI?
- How to Modify Power BI Source Connection Details?
- Show All Articles (13) Collapse Articles
Data Modeling
- Data Modeling in Power BI: Unlocking Powerful Insights
- Types of Schemas in Data Modeling, learn to choose the best for you
- Master Entity Relationships in Power BI and it's 3 types
- What type of schema is preferred for Power BI modeling?
- What are the four types of relationships that can be created between tables in a Power BI model?
- I am not able to create “one to many join” in Power BI. It shows an issue with my dimension table, tell me how can I identify that have a duplicate in my dimension/one-side table.
- What is SCD?
- What is the Role-playing dimension?
- What is the Conformed dimension?
- How to Solve “Many to Many” relationship between facts?
Data visualization
Reporting Functionalities
- How can we pass slicer values across bookmarks?
- What is bookmarks in power bi?
- Before field parameters, how were dynamic dimensions, axes, or rows achieved in Power BI?
- When does conditional formatting (Fx icon) become unavailable in Power BI?
- What is Field Parameters in Power BI? How to create a dynamic Axis using a slicer?
- What is Interactions in Power BI
- What are the three format styles in Power BI conditional formatting?
- What is conditional formatting in Power BI?
- How to do a multi-column sort on a visual in Power BI?
- Difference between Import, DirectQuery, and Live Connection Modes in Power BI
- Why Date table is very important in Power BI?
- I have a visual Brand on the category Axis and net measure on the value axis. I would like to add the city column on the tooltip, but there are multiple cities, how can I show all city values on the tooltip?
- How can one change the theme in Power BI?
- How can I add a constant or Average/Constant Line in my visual?
- What is the Report Tooltip Page?
- What is drill through in Power BI?
- Can I drill through from a card visual?
- How to use the button for Page Navigation?
- Why, I am not able to add Map Visual on the Power BI desktop?
- Why I am not able to see preview features?
- What is RLS in Power BI?
- What is OLS in Power BI?
- What is Calculation Groups?
- What are the usages of “Apply all slicers” and “Clear all Slicers”
- What Power BI features could be improved?
- What is incremental load in Power BI and what are the benefits of using it?
- What is a Power BI on-premises data gateway?
- I have moved my dataset file from the Development workspace to the Test workspace for the very first time. Assuming I have two years of data in the Development workspace, how much data will be there in the Test workspace for the first time before refresh?
- What is the Deployment Pipeline in Power BI?
- How can I transform a Power BI table with columns like Date/city/state, measure, and Value (measure value), where the measure column has values like sales, cost, and margin so that the measure values are in columns instead of rows?
- Show All Articles (14) Collapse Articles
DAX Calculations
- Same Period Last Year Function in Power BI
- What is DAX? (Data Analysis Expressions)
- What is the difference between a Calculated Column and a measure?
- What is the difference between sumx and sum in power bi?
- What is the difference between the CALCULATE and CALCULATETABLE functions in DAX/Power BI?
- the difference between Summarize and SummarizeColumns
- What is the difference between all and allselected in power bi?
- Difference between filtering data in CALCULATE with and without FILTER Expression
- "I have a sales table with a measure called 'Gross.' The sales table is linked to the geography table via the City ID column. The geography table includes columns for City ID, City, and State. I have created the following measure
- What is the difference between RELATED and RELATEDTABLE?
- What is the difference between search and find?
- If in the above visual, I add a column- city id, which also same granularity as a city, and from the same table, will I get the same ranks?
- What is the difference between skip and dense in Rank?
- What are the top 10 states by gross sales from the 'SalesData' table?
- What are the common scenarios in which the Grand Total does not equal the sum of rows in both countable and summable measures?
- What are some best practices related to Time Intelligence or Date Tables?
- What do mean by MTD, QTD, and YTD in Power BI?
- Which functions can I use to obtain MTD, QTD, and YTD results in Power BI?
- Practical Challenge Questions 1 DAX
- Practical Challenge 2 DAX
- Practical Challenge 4 DAX
- Practical Challenge 3 DAX
- Practical Challenge 5 DAX
- In what scenarios can I use the RELATED function?
- What does FIRSTNONBLANKVALUE function do?
- Give examples of Power BI/DAX functions that are very similar to SQL window functions.
- What are the differences between DAX functions Rank and Rankx?
- What is the difference between GENERATE and CROSSJOIN
- What is the difference between the CALENDAR and CALENDARAUTO
- What is the best way to find min values 5 columns or measures for a given table row or visual row?
- How can we repeat the value of a measure or column?
- How can we generate a series of odd numbers or even numbers?
- Provide a measure that gives the Running/cumulative total using the date table
- How to get Top/bottom performer?
- How to add a unique sequence number field in Power BI visual?
- How to append two tables in DAX
- Give some examples of measures we can create using the Window Function.
- How do I calculate the unique combinations of two columns in Power BI?
- How do I sort a column of matrix visual in Power BI using a “Month Year” field in descending order?
- Is there a way to set a date slicer to always show today’s date, or a month slicer to always show the current month in Power BI?
- Provide a measure that gives the Running/cumulative total using the date table.
- How to get Top/bottom performer?
- How to add a unique sequence number field in Power BI visual?
- Give some examples of measures we can create using the Window Function.
- What is the difference between distinct and unique values in Power Query’s column distribution?
- Show All Articles (29) Collapse Articles
Power BI Services
- Row-level Security in Power BI
- Power BI Alerts: Stay updated
- Effortlessly access 'Financial Reports' on your smartphone now!
- Power BI Embedded API integration
- Power BI for all Data-challenges
- What is Microsoft Fabric?
- What do mean by Tenant Setting in Power BI Service?
- What is the Power BI service dashboard?
Same Period Last Year Function in Power BI
A crucial part of the financial analysis is to know whether the business is growing or declining, so, how do we know that? By comparing it to the previous year by using Same Period last Year Function.
Problem Statement for Same Period Last Year
Show a linear chart to compare the trend between two years. As shown in the image below.
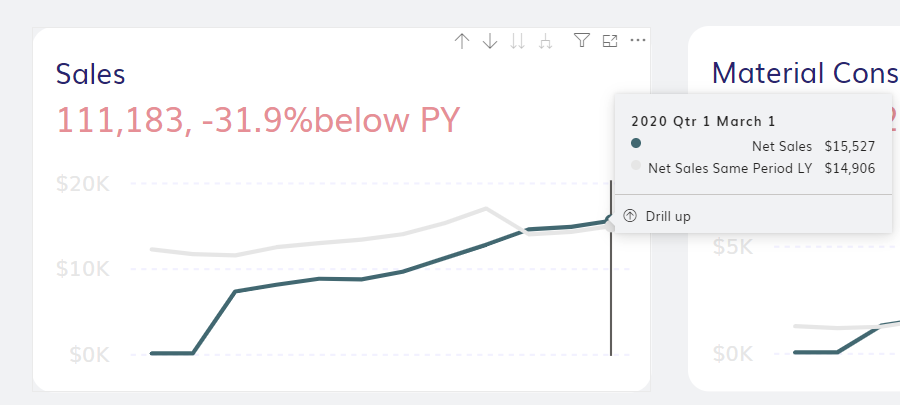
As you can see, we can see FY 19-20 sales by blue line and 18-19 sales by yellow line and tooltip is giving values lying on the data points based on quarters.
Let’s learn How to Make Year Wise Comparison Visual in Power BI
So, DAX in Power BI has a function as “Sameperiodlastyear” which takes the last year date itself. We will be using that to calculate Net sales for previous year.
How to add a New Measure
Step 1: Go to Home tab
Step 2: Go to calculations Selection
Step 3: Click in New Measure (Shown in the Image Below)

Now let’s Add Favorable Measures to Calculate Net Sales and Previous Year Sales
Firstly, we have to create measures. Two measures have been used here, “Net Sales” and “Net Sales Same Period Last Year”.
Let’s Calculate Net Sales Measure:
					Net Sales = CALCULATE(
        [Total Amount],
        FabricData[Category 1] = "Total Sales"
        )
It will calculate the Net sales where category 1 in fabric data is equal to “Total Sales”
Now let’s calculate the Same period Last Year Measure
					Net Sales Same Period LY = CALCULATE(
        [Net Sales],
        SAMEPERIODLASTYEAR(DateTbl[Date])
        )
It will take the previous year sales of the same date as net sales.
Let's Put these Measure in our Visual
Step 1: Select the Line chart Visual from Visualizations Section in power BI
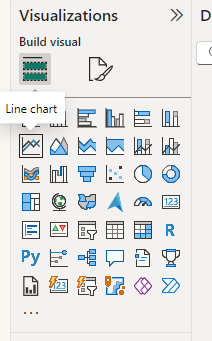
Step 2: Now Select it and you will have a blank visual on the Report View page.
Step 3: Select or drag these measures in the Y-Axis and Month wise date on the X-Axis.
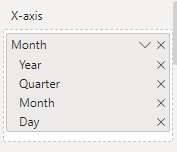
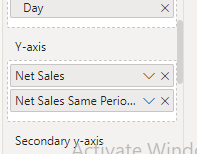
Step 4: After doing the formatting we will get the following Visual in which you can compare the Net sales Same period Last Year 2018-19 and Net Sales 2019-20.
Hurray!! You have learned how to compare between two periods and create measure.
Add comment