
Power BI Interview Questions
What are the Components of Power BI?
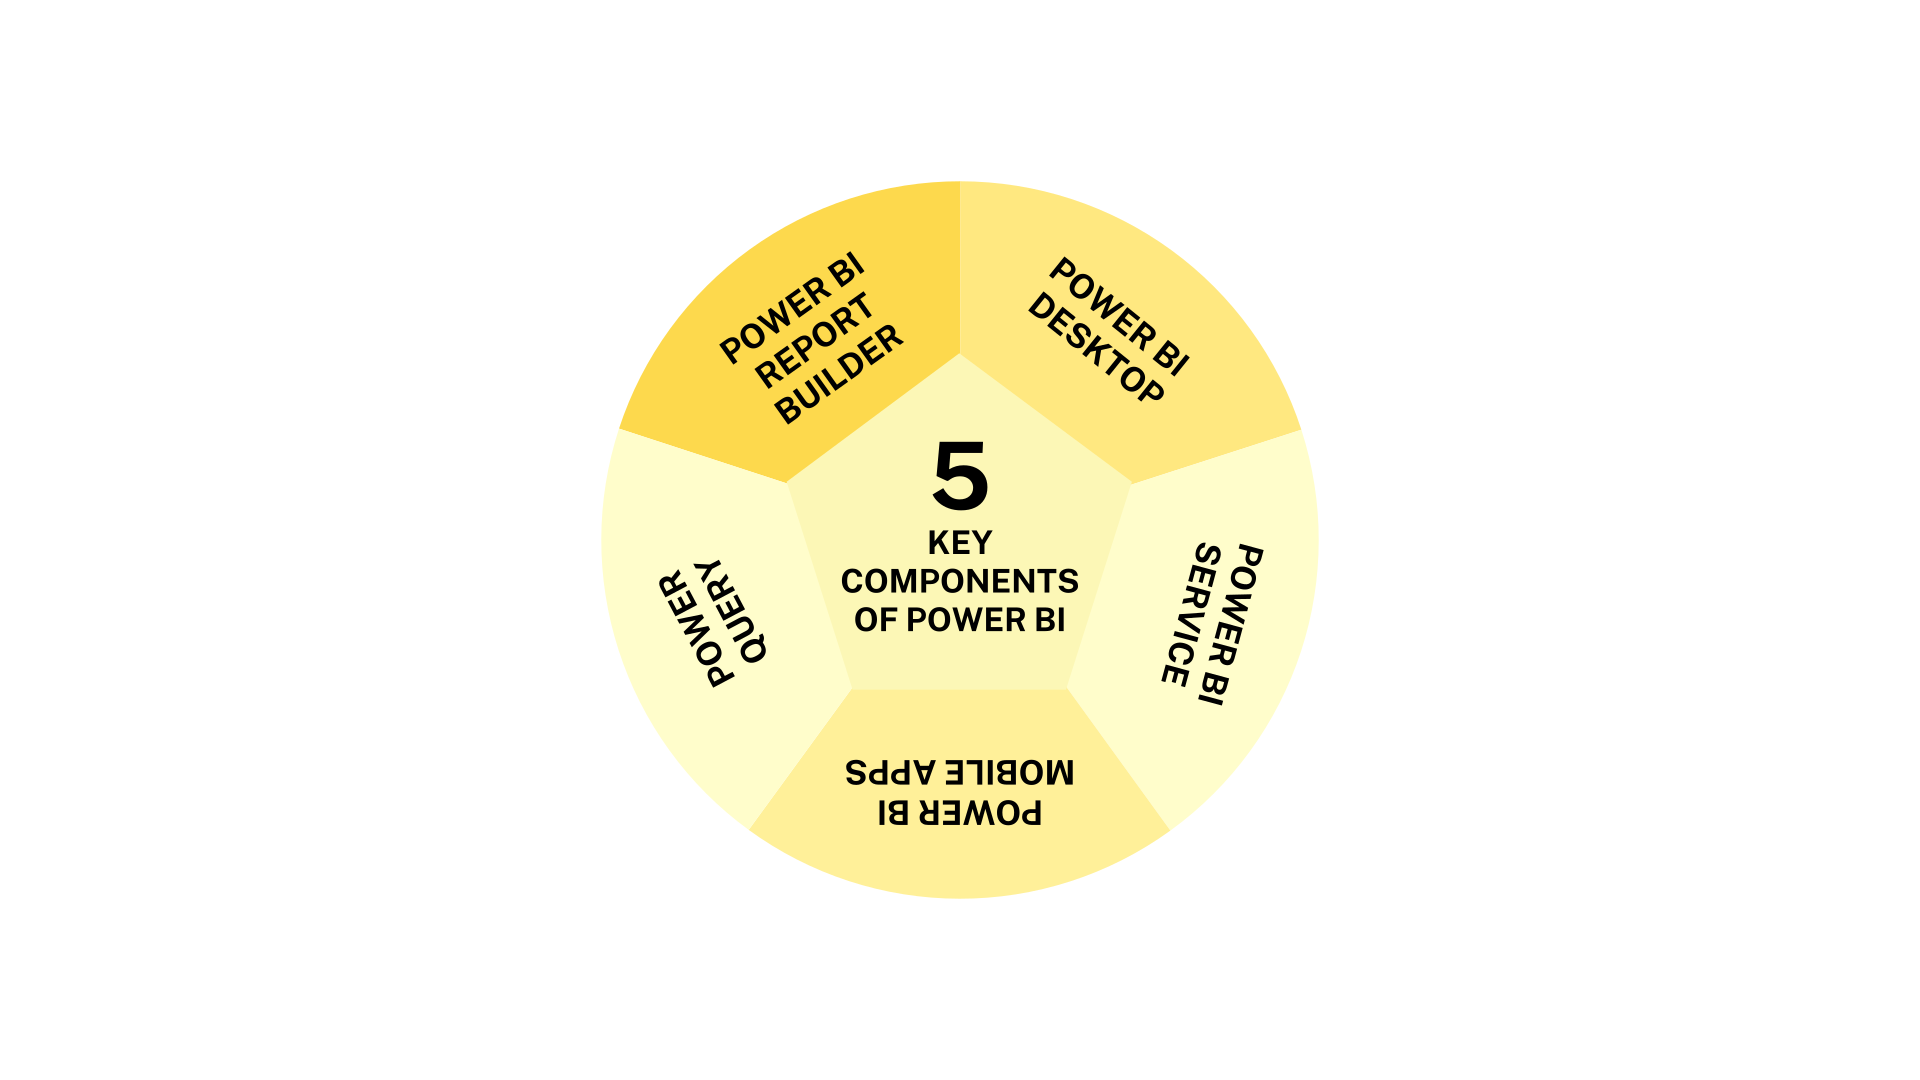
There are 5 Key Components of Power BI
- Power BI Desktop
- Power BI Service
- Power BI Mobile Apps
- Power Query
- Power BI Report Builder
Power BI Desktop – Power BI Desktop is a free tool that allows you to create interactive reports and publish them on the Power BI cloud service. It can connect to many sources—including Excel, SQL Server, Oracle, Azure, and Dynamics—and the import, modeling, and transformation of data become easier. In it, the relationships can be specified, and visualization like graphs, tables, and maps installed. For data accuracy, along with Power Query Editor. Finally, for real-time sharing and collaboration, reports can be published. That is essential for business intelligence.
Power BI Service – The Power BI service is a cloud service for consumption and interactive exploration, through browsers, of the reports that have been published. It enables users to create, share, and consume business insight on any device, and publish from Power BI Desktop, and new reports directly. Other features it supports include collaboration by sharing reports creating team workspaces, and distributing reports as apps. With robust security features, including row-level security over your data, it guarantees that your information is protected. Other than that, it provides display modes for use in detailed analysis and presentations and is able to allow reports to be embedded in PowerPoint and Microsoft Teams.
Power BI Mobile Apps – Power BI Mobile Apps enable you to view and interact with data whenever and wherever it is needed. They are built on top of the Power BI Service, providing capabilities for accessing reports, dashboards, and datasets through mobile devices in an effective, easy manner with the same data and insights. They have offline access, and once the user is online again, it automatically syncs with the Power BI service to have the most recent data available.
Power Query – Power Query is a tool for transforming data. Power Query connects to all sorts of data sources, shapes and transforms data, then loads that data into a worksheet or a Data Model. After connecting to the data source, it will be used to load the data into the model. One of its features includes creating reusable functions from native M functions, and that is a time-saving plus. Power Query also facilitates advanced filtering, and an extensive GUI for management of queries. Besides these, Advanced Editor opens for editing query steps. Data Profiling assists in knowing data distribution, quality, and relationships.
Power BI Report Builder – Power BI Report Builder is a tool to create paginated reports with exact formatting and layout control— perfect for documents like invoices and financial statements. It connects to several data sources, such as SQL Server and Power BI datasets, with flexible data integration. Users can create detailed reports that have headers and footers, tables and charts, and use features like conditional formatting and drill through ability. The reports can be exported as PDF, Word, and Excel and may also be published to the Power BI Service for centralized access and distribution.
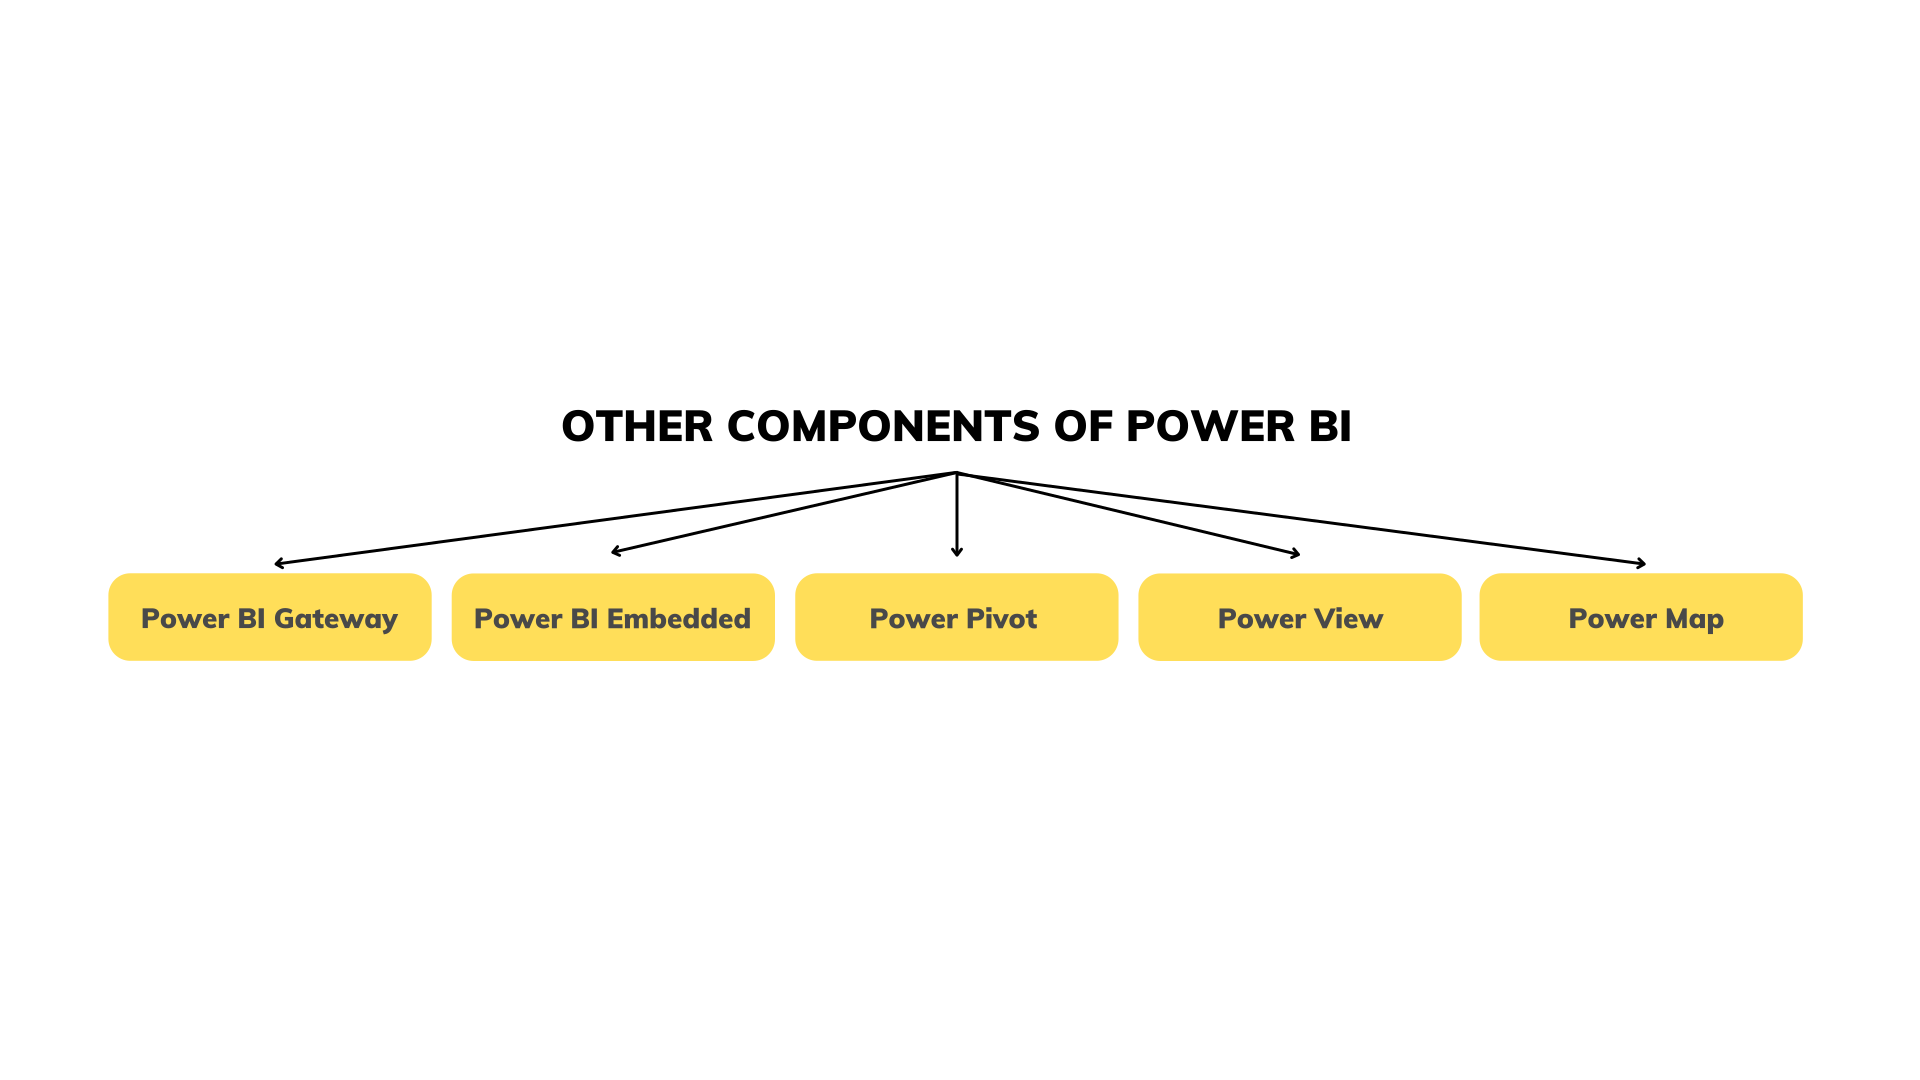
Other Important Components of Power BI
- Power BI Gateway
- Power BI Embedded
- Power Pivot
- Power View
- Power Map
Power BI Gateway – Power BI Gateway is the secure data connector that bridges on-premises data sources with the Power BI cloud services. In this way, there is unified and coherent access to the likes of SQL Server, Oracle, SAP, and file systems for browsing, without copying the data. It enables scheduled data refreshes, and live queries against the on-premises data sources in the gateway, enabling interactive analysis over fresh, up-to-date data. The data does not leave the on-premises secure boundary. The enterprise-level security that comes with this product seamlessly integrates with other Microsoft services like Power Automate and Azure Analysis Services, which is a must for Hybrid Data Strategies in organizations today.
Power BI Embedded – Power BI Embedded Power BI Embedded enables the integration of app developers with interactive Power BI analytics inside custom applications, portals, and websites— all that without ever leaving the app. An ideal solution for ISVs and businesses, it allows reports and dashboards to be embedded using REST APIs and SDKs to ensure integration and customization with ease. The end-users can interact with the visuals, do dynamic filtering, and explore data on the fly. With pay-as-you-go pricing and security capabilities like row-level security, it enables better decision-making and offerings.
Power Pivot – Power Pivot is an advanced tool for data modeling and some say it’s even more of a feature for Excel and Power BI than were past iterations. This handles large data sets and accommodates more complex calculations. Indeed, it enables the creation of robust data models through multi-source data import with relationship and deep analysis capabilities. It is based on the VertiPaq engine to ensure compression of data is effective and performance quick. This enables users to create calculated columns, measures, and KPIs by applying DAX. Power Pivot makes analytical work easier-working with unified data models and coherent reports in Excel and Power BI just became a piece of cake.
Power View – Power View is Interactive data visualization tool by its own right within Power BI, hence end users can create appealing reports and dashboards with ad hoc, interactive data exploration. Indeed data transformed into meaningful insights drawn as charts, graphs, maps, and tables to enable trends and patterns easily stand out. Such advanced visualization allows data filtering and data highlighting in the view itself. Since it is integrated with robust data models of Power Pivot, it has the capability to update visuals in real-time. Even though largely replaced by Power BI Desktop and Service, it remains a valuable asset for reporting within Excel.
Power Map – Power Map is a 3D data visualization tool found in Power BI that converts data into powerful interactive geospatial insights. It enables the visualization and interactive exploration of location-based data, bringing out patterns and trends that cannot be seen in ordinary charts.
Add comment